Use the below link to get a discount on my course ArcPy for Data Management and Geoprocessing with ArcGIS Pro on Udemy
ArcPy for Data Management and Geoprocessing with ArcGIS Pro – Course Discount
Reply

Use the below link to get a discount on my course ArcPy for Data Management and Geoprocessing with ArcGIS Pro on Udemy
Interested in learning ArcPy? check out this course.
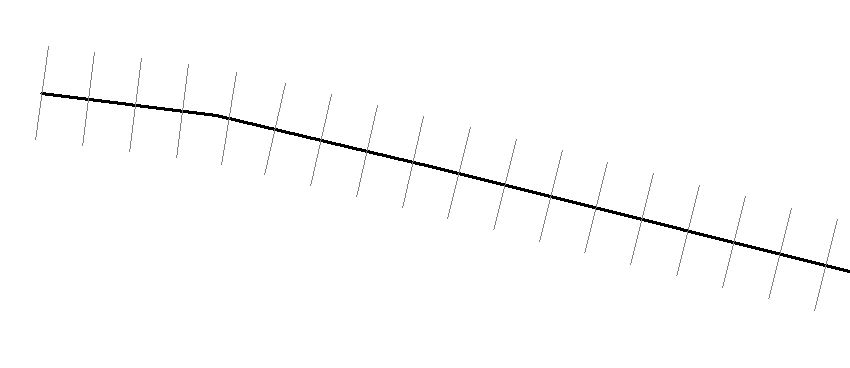
This builds on from the previous post creating points at specified distances along a line. Here, we create perpendicular chainage ticks that traverse the main line.
from osgeo import ogr
from shapely.geometry import MultiLineString, LineString, Point
from shapely import wkt
import sys, math

## http://wikicode.wikidot.com/get-angle-of-line-between-two-points
## angle between two points
def getAngle(pt1, pt2):
    x_diff = pt2.x - pt1.x
    y_diff = pt2.y - pt1.y
    return math.degrees(math.atan2(y_diff, x_diff))

## start and end points of chainage tick
## get the first end point of a tick
def getPoint1(pt, bearing, dist):
    angle = bearing + 90
    bearing = math.radians(angle)
    x = pt.x + dist * math.cos(bearing)
    y = pt.y + dist * math.sin(bearing)
    return Point(x, y)
## get the second end point of a tick
def getPoint2(pt, bearing, dist):
    bearing = math.radians(bearing)
    x = pt.x + dist * math.cos(bearing)
    y = pt.y + dist * math.sin(bearing)
    return Point(x, y)

## set the driver for the data
driver = ogr.GetDriverByName("FileGDB")
## path to the FileGDB
gdb = r"C:\Users\******\Documents\ArcGIS\Default.gdb"
## open the GDB in write mode (1)
ds = driver.Open(gdb, 1)

## linear feature class
input_lyr_name = "input_line"

## distance between each points
distance = 10
## the length of each tick
tick_length = 20

## output tick line fc name
output_lns = "{0}_{1}m_lines".format(input_lyr_name, distance)

## list to hold all the point coords
list_points = []

## reference the layer using the layers name
if input_lyr_name in [ds.GetLayerByIndex(lyr_name).GetName() for lyr_name in range(ds.GetLayerCount())]:
    lyr = ds.GetLayerByName(input_lyr_name)
    print "{0} found in {1}".format(input_lyr_name, gdb)

## if the output already exists then delete it
if output_lns in [ds.GetLayerByIndex(lyr_name).GetName() for lyr_name in range(ds.GetLayerCount())]:
    ds.DeleteLayer(output_lns)
    print "Deleting: {0}".format(output_lns)

## create a new line layer with the same spatial ref as lyr
out_ln_lyr = ds.CreateLayer(output_lns, lyr.GetSpatialRef(), ogr.wkbLineString)

## distance/chainage attribute
chainage_fld = ogr.FieldDefn("CHAINAGE", ogr.OFTReal)
out_ln_lyr.CreateField(chainage_fld)
## check the geometry is a line
first_feat = lyr.GetFeature(1)

## accessing linear feature classes using FileGDB driver always returns a MultiLinestring
if first_feat.geometry().GetGeometryName() in ["LINESTRING", "MULTILINESTRING"]:
    for ln in lyr:
        ## list to hold all the point coords
        list_points = []
        ## set the current distance to place the point
        current_dist = distance
        ## get the geometry of the line as wkt
        line_geom = ln.geometry().ExportToWkt()
        ## make shapely MultiLineString object
        shapely_line = MultiLineString(wkt.loads(line_geom))
        ## get the total length of the line
        line_length = shapely_line.length
        ## append the starting coordinate to the list
        list_points.append(Point(list(shapely_line[0].coords)[0]))
        ## https://nathanw.net/2012/08/05/generating-chainage-distance-nodes-in-qgis/
        ## while the current cumulative distance is less than the total length of the line
        while current_dist < line_length:
            ## use interpolate and increase the current distance
            list_points.append(shapely_line.interpolate(current_dist))
            current_dist += distance
        ## append end coordinate to the list
        list_points.append(Point(list(shapely_line[0].coords)[-1]))

        ## add lines to the layer
        ## this can probably be cleaned up better
        ## but it works and is fast!
        for num, pt in enumerate(list_points, 1):
            ## start chainage 0
            if num == 1:
                angle = getAngle(pt, list_points[num])
                line_end_1 = getPoint1(pt, angle, tick_length/2)
                angle = getAngle(line_end_1, pt)
                line_end_2 = getPoint2(line_end_1, angle, tick_length)
                tick = LineString([(line_end_1.x, line_end_1.y), (line_end_2.x, line_end_2.y)])
                feat_dfn_ln = out_ln_lyr.GetLayerDefn()
                feat_ln = ogr.Feature(feat_dfn_ln)
                feat_ln.SetGeometry(ogr.CreateGeometryFromWkt(tick.wkt))
                feat_ln.SetField("CHAINAGE", 0)
                out_ln_lyr.CreateFeature(feat_ln)

            ## everything in between
            if num < len(list_points) - 1:
                angle = getAngle(pt, list_points[num])
                line_end_1 = getPoint1(list_points[num], angle, tick_length/2)
                angle = getAngle(line_end_1, list_points[num])
                line_end_2 = getPoint2(line_end_1, angle, tick_length)
                tick = LineString([(line_end_1.x, line_end_1.y), (line_end_2.x, line_end_2.y)])
                feat_dfn_ln = out_ln_lyr.GetLayerDefn()
                feat_ln = ogr.Feature(feat_dfn_ln)
                feat_ln.SetGeometry(ogr.CreateGeometryFromWkt(tick.wkt))
                feat_ln.SetField("CHAINAGE", distance * num)
                out_ln_lyr.CreateFeature(feat_ln)

            ## end chainage
            if num == len(list_points):
                angle = getAngle(list_points[num - 2], pt)
                line_end_1 = getPoint1(pt, angle, tick_length/2)
                angle = getAngle(line_end_1, pt)
                line_end_2 = getPoint2(line_end_1, angle, tick_length)
                tick = LineString([(line_end_1.x, line_end_1.y), (line_end_2.x, line_end_2.y)])
                feat_dfn_ln = out_ln_lyr.GetLayerDefn()
                feat_ln = ogr.Feature(feat_dfn_ln)
                feat_ln.SetGeometry(ogr.CreateGeometryFromWkt(tick.wkt))
                feat_ln.SetField("CHAINAGE", int(line_length))
                out_ln_lyr.CreateFeature(feat_ln)

del ds
The output is a linear feature class containing chainage ticks and distance attribute.

Please leave comments if this can be improved or if you found it useful.
Interested in learning ArcPy? check out this course.
This workflow with Python using OGR and Shapely creates points along a line at a specified distance interval. I use the FileGDB driver here to read from and write data to but you can change these to suit your requirements. The code is commented…
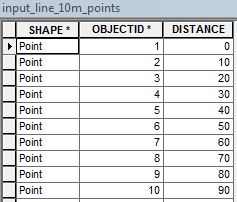
from osgeo import ogr
from shapely.geometry import MultiLineString, Point
from shapely import wkt
import sys

## set the driver for the data
driver = ogr.GetDriverByName("FileGDB")
################################################################################
## CHANGE gdb, input_lyr_name, distance, output_pts (optional)

## path to the FileGDB
gdb = r"C:\Users\******\Documents\ArcGIS\Default.gdb"
## open the GDB in write mode (1)
ds = driver.Open(gdb, 1)

## single linear feature
input_lyr_name = "input_line"

## distance between each points
distance = 10

## output point fc name
output_pts = "{0}_{1}m_points".format(input_lyr_name, distance)
################################################################################

## reference the layer using the layers name
if input_lyr_name in [ds.GetLayerByIndex(lyr_name).GetName() for lyr_name in range(ds.GetLayerCount())]:
    lyr = ds.GetLayerByName(input_lyr_name)
    print "{0} found in {1}".format(input_lyr_name, gdb)
## if the feature class cannot be found exit gracefully
else:
    print "{0} NOT found in {1}".format(input_lyr_name, gdb)
    sys.exit()

## if the output already exists then delete it
if output_pts in [ds.GetLayerByIndex(lyr_name).GetName() for lyr_name in range(ds.GetLayerCount())]:
    ds.DeleteLayer(output_pts)
    print "Deleting: {0}".format(output_pts)

## create a new point layer with the same spatial ref as lyr
out_lyr = ds.CreateLayer(output_pts, lyr.GetSpatialRef(), ogr.wkbPoint)

## create a field to hold the distance values
dist_fld = ogr.FieldDefn("DISTANCE", ogr.OFTReal)
out_lyr.CreateField(dist_fld)
## check the geometry is a line
first_feat = lyr.GetFeature(1)

## accessing linear feature classes using FileGDB driver always returns a MultiLinestring
if first_feat.geometry().GetGeometryName() in ["LINESTRING", "MULTILINESTRING"]:
    for ln in lyr:
        ## list to hold all the point coords
        list_points = []
        ## set the current distance to place the point
        current_dist = distance
        ## get the geometry of the line as wkt
        line_geom = ln.geometry().ExportToWkt()
        ## make shapely MultiLineString object
        shapely_line = MultiLineString(wkt.loads(line_geom))
        ## get the total length of the line
        line_length = shapely_line.length
        ## append the starting coordinate to the list
        list_points.append(Point(list(shapely_line[0].coords)[0]))
        ## https://nathanw.net/2012/08/05/generating-chainage-distance-nodes-in-qgis/
        ## while the current cumulative distance is less than the total length of the line
        while current_dist < line_length:
            ## use interpolate and increase the current distance
            list_points.append(shapely_line.interpolate(current_dist))
            current_dist += distance
        ## append end coordinate to the list
        list_points.append(Point(list(shapely_line[0].coords)[-1]))

        ## add points to the layer
        ## for each point in the list
        for num, pt in enumerate(list_points, 1):
            ## create a point object
            pnt = ogr.Geometry(ogr.wkbPoint)
            pnt.AddPoint(pt.x, pt.y)
            feat_dfn = out_lyr.GetLayerDefn()
            feat = ogr.Feature(feat_dfn)
            feat.SetGeometry(pnt)
            ## populate the distance values for each point.
            ## start point
            if num == 1:
                feat.SetField("DISTANCE", 0)
            elif num < len(list_points):
                feat.SetField("DISTANCE", distance * (num - 1))
            ## end point
            elif num == len(list_points):
                feat.SetField("DISTANCE", int(line_length))
            ## add the point feature to the output.
            out_lyr.CreateFeature(feat)

else:
    print "Error: make sure {0} is a linear feature class with at least one feature".format(input_lyr_name)
    sys.exit()

del ds, out_lyr
This will create a point feature class with a single attribute containing the distance value from the start of the line.

 Please leave any constructive feedback if you think this can be improved or if it worked for you.
Also see Create Chainage Ticks for creating perpendicular lines traversing the main line at specified distances.
Interested in learning ArcPy? check out this course.
(Open Source Geospatial Python)
The ‘What is it?’
The Standard Distance, also know as the Standard Distance Deviation, is the average distance all features vary from the Mean Center and measures the compactness of a distribution. The Standard Distance is a value representing the distance in units from the Mean Center and is usually plotted on a map as a circle for a visual indication of dispersion, the Standard Distance is the radius.
The Standard Distance works best in the absence of a strong directional trend. According to Andy Mitchell, if a directional trend is present you are better off using the Standard Deviational Ellipse.
You can use the Standard Distance to compare territories between species, which has the wider/broader territory, or to compare changes over time such as the dispersion of burglaries for each calendar month.
In a Normal Distribution you would expect around 68% of all points to fall within the Standard Distance.
The Formula!
The mean x-coordinate is subtracted from the x-coordinate value for each point and the difference is squared. The sum of all the squared values for x minus the x-mean is divided by the number of points. This is also performed for y-coordinates. The resulting values for x and y are summed and then we take the square root of this value to return the value to original distance units.
First we get the mean X and Y…

…and then the Standard Distance

For Point features the X and Y coordinates of each feature is used, for Polygons the centroid of each feature represents the X and Y coordinate to use, and for Linear features the mid-point of each line is used for the X and Y coordinate.
The Code…
from osgeo import ogr
from shapely.geometry import MultiLineString
from shapely import wkt
import numpy as np
import sys, math

## set the driver for the data
driver = ogr.GetDriverByName("FileGDB")
## path to the FileGDB
gdb = r"C:\Users\Glen B\Documents\ArcGIS\Default.gdb"
## ope the GDB in write mode (1)
ds = driver.Open(gdb, 1)

input_lyr_name = "Birmingham_Burglaries_2016"

output_fc = "{0}_standard_distance".format(input_lyr_name)

## reference the layer using the layers name
if input_lyr_name in [ds.GetLayerByIndex(lyr_name).GetName() for lyr_name in range(ds.GetLayerCount())]:
    lyr = ds.GetLayerByName(input_lyr_name)
    print "{0} found in {1}".format(input_lyr_name, gdb)

if output_fc in [ds.GetLayerByIndex(lyr_name).GetName() for lyr_name in range(ds.GetLayerCount())]:
    ds.DeleteLayer(output_fc)
    print "Deleting: {0}".format(output_fc)

try:
    ## for points and polygons we use the centroid
    first_feat = lyr.GetFeature(1)
    if first_feat.geometry().GetGeometryName() in ["POINT", "MULTIPOINT", "POLYGON", "MULTIPOLYGON"]:
        xy_arr = np.ndarray((len(lyr), 2), dtype=np.float)
        for i, pt in enumerate(lyr):
            ft_geom = pt.geometry()
            xy_arr[i] = (ft_geom.Centroid().GetX(), ft_geom.Centroid().GetY())

    ## for lines we get the midpoint of a line
    elif first_feat.geometry().GetGeometryName() in ["LINESTRING", "MULTILINESTRING"]:
        xy_arr = np.ndarray((len(lyr), 2), dtype=np.float)
        for i, ln in enumerate(lyr):
            line_geom = ln.geometry().ExportToWkt()
            shapely_line = MultiLineString(wkt.loads(line_geom))
            midpoint = shapely_line.interpolate(shapely_line.length/2)
            xy_arr[i] = (midpoint.x, midpoint.y)

except Exception:
    print "Unknown geometry for {}".format(input_lyr_name)
    sys.exit()

avg_x, avg_y = np.mean(xy_arr, axis=0)

print "Mean Center: {0}, {1}".format(avg_x, avg_y)

sum_of_sq_diff_x = 0.0
sum_of_sq_diff_y = 0.0

for x, y in xy_arr:
    diff_x = math.pow(x - avg_x, 2)
    diff_y = math.pow(y - avg_y, 2)
    sum_of_sq_diff_x += diff_x
    sum_of_sq_diff_y += diff_y

sum_of_results = (sum_of_sq_diff_x/lyr.GetFeatureCount()) + (sum_of_sq_diff_y/lyr.GetFeatureCount())
standard_distance = math.sqrt(sum_of_results)
print "Standard Distance: {0}". format(standard_distance)

## create a point with the mean center
## and buffer by the standard distance
pnt = ogr.Geometry(ogr.wkbPoint)
pnt.AddPoint(avg_x, avg_y)
polygon = pnt.Buffer(standard_distance, 90)

## create a new polygon layer with the same spatial ref as lyr
out_lyr = ds.CreateLayer(output_fc, lyr.GetSpatialRef(), ogr.wkbPolygon)

## define and create new fields
x_fld = ogr.FieldDefn("X", ogr.OFTReal)
y_fld = ogr.FieldDefn("Y", ogr.OFTReal)
stnd_dst = ogr.FieldDefn("Standard_Distance", ogr.OFTReal)
out_lyr.CreateField(x_fld)
out_lyr.CreateField(y_fld)
out_lyr.CreateField(stnd_dst)

## add the standard distance buffer to the layer
feat_dfn = out_lyr.GetLayerDefn()
feat = ogr.Feature(feat_dfn)
feat.SetGeometry(polygon)
feat.SetField("X", avg_x)
feat.SetField("Y", avg_y)
feat.SetField("Standard_Distance", standard_distance)
out_lyr.CreateFeature(feat)

print "Created {0}".format(output_fc)

## free up resources
del feat, ds, lyr, out_lyr
I’d like to give credit to Logan Byers from GIS StackExchange who aided in speeding up the computational time using NumPy and for forcing me to begin learning the wonders of NumPy (getting there bit by bit).
The Example:
I downloaded crime data from DATA.POLICE.UK for the West Midlands Police from January 2016 to December 2016. I used some Python to extract just the Burglary data and made this into a feature class in the File GDB. Next, I downloaded OS Boundary Line data and clipped the Burglary data to just Birmingham. Everything was now in place to find the Standard Distance of all burglaries for Birmingham in 2016. (see The Other Scripts section at the bottom of this post for processing the data)
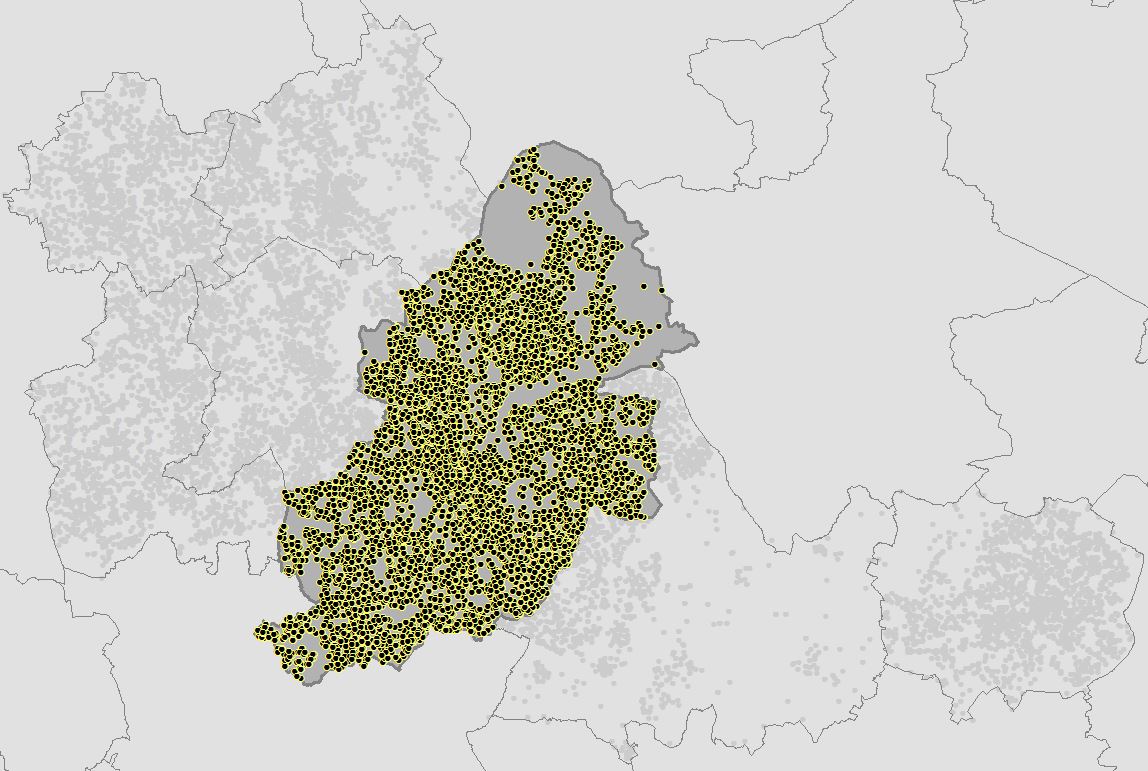
Running the script from The Code section above calculates the Standard Distance for burglaries in Birmingham for 2016 and creates a polygon feature class in the File GDB.

OSGP Mean Center: 407926.695396, 286615.428507
ArcGIS Mean Center: 407926.695396, 286615.428507
OSGP Standard Distance: 6416.076596
ArcGIS Standard Distance: 6416.076596
Also See…
Mean Center
Central Feature
Median Center
Initial Data Assessment
The Resources:
ESRI Guide to GIS Volume 2: Chapter 2 (I highly recommend this book)
see book review here.
Setting up GDAL/OGR with FileGDB Driver for Python on Windows
< The Other Scripts >
1. Extract Burglary Data for West Midlands
import csv, os
from osgeo import ogr, osr

## set the driver for the data
driver = ogr.GetDriverByName("FileGDB")

## path to the FileGDB
gdb = r"C:\Users\Glen B\Documents\my_geodata.gdb"

## ope the GDB in write mode (1)
ds = driver.Open(gdb, 1)

## the coordinates in the csv files are lat/long
source = osr.SpatialReference()
source.ImportFromEPSG(4326)

## we need the data in British National Grid
target = osr.SpatialReference()
target.ImportFromEPSG(27700)

transform = osr.CoordinateTransformation(source, target)

## set the output fc name
output_fc = "WM_Burglaries_2016"

## if the output fc already exists delete it
if output_fc in [ds.GetLayerByIndex(lyr_name).GetName() for lyr_name in range(ds.GetLayerCount())]:
    ds.DeleteLayer(output_fc)
    print "Deleting: {0}".format(output_fc)

out_lyr = ds.CreateLayer(output_fc, target, ogr.wkbPoint)

## define and create new fields
mnth_fld = ogr.FieldDefn("Month", ogr.OFTString)
rep_by_fld = ogr.FieldDefn("Reported_by", ogr.OFTString)
fls_wthn_fld = ogr.FieldDefn("Falls_within", ogr.OFTString)
loc_fld = ogr.FieldDefn("Location", ogr.OFTString)
lsoa_c_fld = ogr.FieldDefn("LSOA_code", ogr.OFTString)
lsoa_n_fld = ogr.FieldDefn("LSOA_name", ogr.OFTString)
crime_fld = ogr.FieldDefn("Crime_type", ogr.OFTString)
outcome_fld = ogr.FieldDefn("Last_outcome", ogr.OFTString)

out_lyr.CreateField(mnth_fld)
out_lyr.CreateField(rep_by_fld)
out_lyr.CreateField(fls_wthn_fld)
out_lyr.CreateField(loc_fld)
out_lyr.CreateField(lsoa_c_fld)
out_lyr.CreateField(lsoa_n_fld)
out_lyr.CreateField(crime_fld)
out_lyr.CreateField(outcome_fld)

## where the downloaded csv files reside
root_folder = r"C:\Users\Glen B\Documents\Crime"

## for each csv
for root,dirs,files in os.walk(root_folder):
    for filename in files:
        if filename.endswith(".csv"):
            csv_path = "{0}\\{1}".format(root, filename)
            with open(csv_path, "rb") as csvfile:
                reader = csv.reader(csvfile, delimiter=",")
                next(reader,None)
                ## create a point with attributes for each burglary
                for row in reader:
                    if row[9] == "Burglary":
                        pnt = ogr.Geometry(ogr.wkbPoint)
                        pnt.AddPoint(float(row[4]), float(row[5]))
                        pnt.Transform(transform)
                        feat_dfn = out_lyr.GetLayerDefn()
                        feat = ogr.Feature(feat_dfn)
                        feat.SetGeometry(pnt)
                        feat.SetField("Month", row[1])
                        feat.SetField("Reported_by", row[2])
                        feat.SetField("Falls_within", row[3])
                        feat.SetField("Location", row[6])
                        feat.SetField("LSOA_code", row[7])
                        feat.SetField("LSOA_name", row[8])
                        feat.SetField("Crime_type", row[9])
                        feat.SetField("Last_outcome", row[10])
                        out_lyr.CreateFeature(feat)

del ds, feat, out_lyr
2. Birmingham Burglaries Only
from osgeo import ogr

## required drivers
shp_driver = ogr.GetDriverByName("ESRI Shapefile")
gdb_driver = ogr.GetDriverByName("FileGDB")

## input boundary shapefile and file gdb
shapefile = r"C:\Users\Glen B\Documents\Crime\Data\GB\district_borough_unitary_region.shp"
gdb = r"C:\Users\Glen B\Documents\my_geodata.gdb"

## open the shapefile in read mode and gdb in write mode
shp_ds = shp_driver.Open(shapefile, 0)
gdb_ds = gdb_driver.Open(gdb, 1)

## reference the necessary layers
shp_layer = shp_ds.GetLayer(0)
gdb_layer = gdb_ds.GetLayerByName("WM_Burglaries_2016")

## filter the shapefile
shp_layer.SetAttributeFilter("NAME = 'Birmingham District (B)'")

## set the name for the output feature class
output_fc = "Birmingham_Burglaries_2016"

## if the output already exists then delete it
if output_fc in [gdb_ds.GetLayerByIndex(lyr_name).GetName() for lyr_name in range(gdb_ds.GetLayerCount())]:
    gdb_ds.DeleteLayer(output_fc)
    print "Deleting: {0}".format(output_fc)

## create an output layer
out_lyr = gdb_ds.CreateLayer(output_fc, shp_layer.GetSpatialRef(), ogr.wkbPoint)

## copy the schema from the West Midlands burglaries
## and use it for the Birmingham burglaries
lyr_def = gdb_layer.GetLayerDefn()
for i in range(lyr_def.GetFieldCount()):
    out_lyr.CreateField (lyr_def.GetFieldDefn(i))

## only get burglaries that intersect the Birmingham region
for shp_feat in shp_layer:
    print shp_feat.GetField("NAME")
    birm_geom = shp_feat.GetGeometryRef()
    for gdb_feat in gdb_layer:
        burglary_geom = gdb_feat.GetGeometryRef()
        if burglary_geom.Intersects(birm_geom):
            feat_dfn = out_lyr.GetLayerDefn()
            feat = ogr.Feature(feat_dfn)
            feat.SetGeometry(burglary_geom)

            ## populate the attribute table
            for i in range(lyr_def.GetFieldCount()):
                feat.SetField(lyr_def.GetFieldDefn(i).GetNameRef(), gdb_feat.GetField(i))
            ## create the feature
            out_lyr.CreateFeature(feat)
            feat.Destroy()

del shp_ds, shp_layer, gdb_ds, gdb_layer
The Usual 🙂
As always please feel free to comment to help make the code more efficient, highlight errors, or let me know if this was of any use to you.
Interested in learning ArcPy? check out this course.
(Open Source Geospatial Python)
The ‘What is it?’
See Mean Center.
The unweighted center is mainly used for events that occur at a place and time such as burglaries. The weighted center, however, is predominantly used for stationary features such as retail outlets or delineated areas for example (such as Census tracts). The Weighted Mean Center does not take into account distance between features in the dataset.
The weight needs to be a numerical attribute. The greater the value, the higher the weight for that feature.
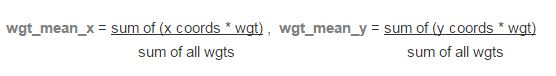
The Formula!
The Weighted Mean Center is calculated by multiplying the x and y coordinate by the weight for that feature and summing all for both x and y individually, and then dividing this by the sum of all the weights.
 For Point features the X and Y coordinates of each feature is used, for Polygons the centroid of each feature represents the X and Y coordinate to use, and for Linear features the mid-point of each line is used for the X and Y coordinate.
The Code…
from osgeo import ogr
from shapely.geometry import MultiLineString
from shapely import wkt
import numpy as np
import sys

## set the driver for the data
driver = ogr.GetDriverByName("ESRI Shapefile")
## folder where the shapefile resides
folder = r"C:\Users\glen.bambrick\Documents\GDAL\shp\\"
## name of the shapefile concatenated with folder
shp = "{0}Census2011_Small_Areas_generalised20m.shp".format(folder)
## open the shapefile
ds = driver.Open(shp, 0)
## reference the only layer in the shapefile
lyr = ds.GetLayer(0)

## create an output data source
out_ds = driver.CreateDataSource("{0}{1}_wgt_mean_center.shp".format(folder,lyr.GetName()))

## output mean center weighted filename
output_fc = "{0}{1}_wgt_mean_center".format(folder,lyr.GetName())

## field that has numerical weight
weight_fld = "TOTAL2011"

try:
    first_feat = lyr.GetFeature(1)
    xy_arr = np.ndarray((len(lyr), 2), dtype=np.float)
    wgt_arr = np.ndarray((len(lyr), 1), dtype=np.float)
    ## use the centroid for points and polygons
    if first_feat.geometry().GetGeometryName() in ["POINT", "MULTIPOINT", "POLYGON", "MULTIPOLYGON"]:
        for i, pt in enumerate(lyr):
            ft_geom = pt.geometry()
            weight = pt.GetField(weight_fld)
            xy_arr[i] = (ft_geom.Centroid().GetX() * weight, ft_geom.Centroid().GetY() * weight)
            wgt_arr[i] = weight
    ## midpoint of lines
    elif first_feat.geometry().GetGeometryName() in ["LINESTRING", "MULTILINESTRING"]:
        for i, ln in enumerate(lyr):
            line_geom = ln.geometry().ExportToWkt()
            weight = ln.GetField(weight_fld)
            shapely_line = MultiLineString(wkt.loads(line_geom))
            midpoint = shapely_line.interpolate(shapely_line.length/2)
            xy_arr[i] = (midpoint.x * weight, midpoint.y * weight)
            wgt_arr[i] = weight

except Exception:
    print "Unknown geometry or Incorrect field name for {}".format(input_lyr_name)
    sys.exit()

## do the maths
sum_x, sum_y = np.sum(xy_arr, axis=0)
sum_wgt = np.sum(wgt_arr)
weighted_x, weighted_y = sum_x/sum_wgt, sum_y/sum_wgt

print "Weighted Mean Center: {0}, {1}".format(weighted_x, weighted_y)

## create a new point layer with the same spatial ref as lyr
out_lyr = out_ds.CreateLayer(output_fc, lyr.GetSpatialRef(), ogr.wkbPoint)

## define and create new fields
x_fld = ogr.FieldDefn("X", ogr.OFTReal)
y_fld = ogr.FieldDefn("Y", ogr.OFTReal)
out_lyr.CreateField(x_fld)
out_lyr.CreateField(y_fld)

## create a new point for the mean center weighted
pnt = ogr.Geometry(ogr.wkbPoint)
pnt.AddPoint(weighted_x, weighted_y)

## add the mean center weighted to the new layer
feat_dfn = out_lyr.GetLayerDefn()
feat = ogr.Feature(feat_dfn)
feat.SetGeometry(pnt)
feat.SetField("X", weighted_x)
feat.SetField("Y", weighted_y)
out_lyr.CreateFeature(feat)

print "Created: {0}.shp".format(output_fc)

## free up resources
del ds, out_ds, lyr, first_feat, feat, out_lyr
I’d like to give credit to Logan Byers from GIS StackExchange who aided in speeding up the computational time using NumPy and for forcing me to begin learning the wonders of NumPy (which is still a work in progress)
The Example:
I downloaded the Small Areas of Ireland from the CSO. You will have to acknowledge a disclaimer. The data contains population information for the 2011 Census. Once downloaded unzip Census2011_Small_Areas_generalised20m.zip to working folder.

Running the script from The Code section above calculates the Weighted Mean Center of all Small Areas based on the population count for each for 2011 and creates a point Shapefile as the output.

OSGP Weighted Mean Center: 238557.427484, 208347.116116
ArcGIS Weighted Mean Center: 238557.427484, 208347.116116
Also See…
Mean Center
Central Feature
Median Center
Initial Data Assessment
The Resources:
ESRI Guide to GIS Volume 2: Chapter 2 (I highly recommend this book)
see book review here.
The Usual 🙂
As always please feel free to comment to help make the code more efficient, highlight errors, or let me know if this was of any use to you.
